The emergence of information technology as a major tool of communication has brought about a complete change in the way written, verbal or visual content is designed. More and more people have started looking for well-structured pieces of readable content which are both, relevant and engaging. As a result, content creators have begun to use a variety of techniques to present important chunks of information in an interesting, attractive and efficient way.
One such technique that has gained immense traction in recent times is that of Infographics.
What Are Infographics?
As the name itself suggests, an infographic is essentially a combination of two words – Information and Graphics. This simply means that an infographic uses representative graphics like charts, bars, columns and diagrams to convey complex information like facts, figures and data, in a manner that is condensed, lucid and understandable. Being a purely visual medium, an infographic design is meant to break down the most complicated of details and present them for quick and clear consumption.
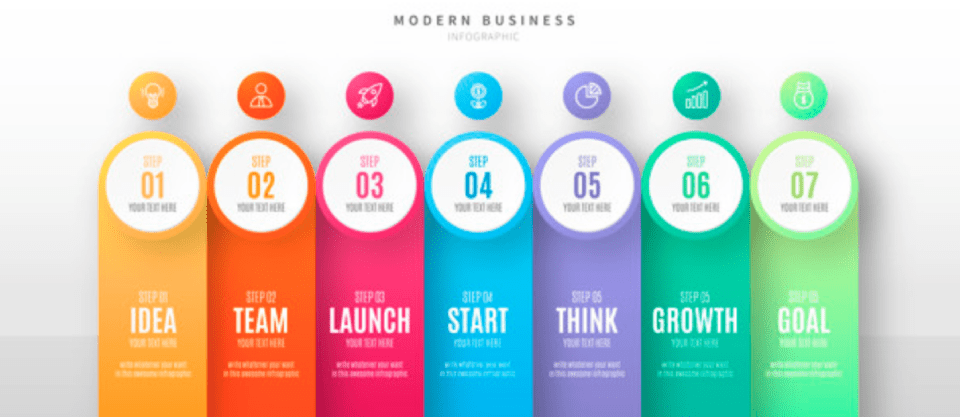
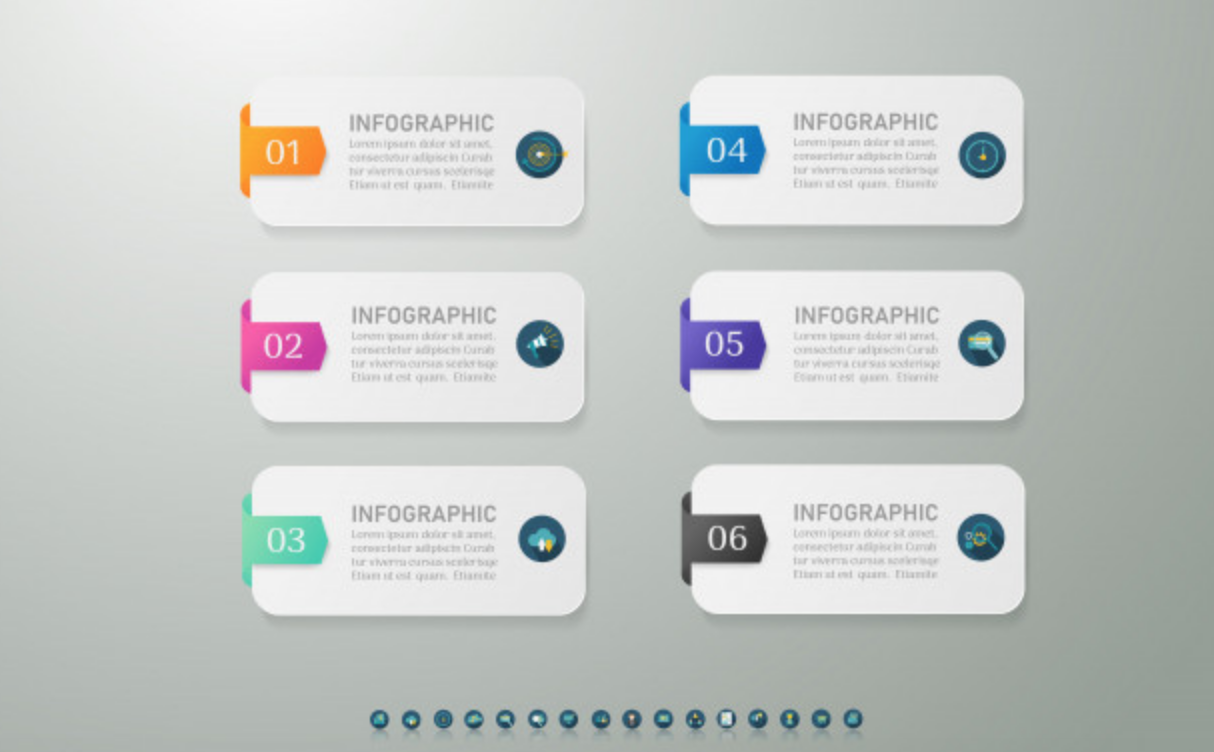
For instance, consider the following infographic example:

In this infographic design, the steps which help make a business strategy successful have been listed in an explicit and methodical way. Had the same information been conveyed in words, it might not have had a similar appeal for the audience. However, by using an illustration, the infographic creator has turned various incomprehensible bits of information into a simple, transparent and intelligible chart. This simplicity is precisely why about 84% of individuals and businesses who use infographic designs, consider them to be highly effective and marketable.
Nonetheless, before you get down to the actual process of making an infographic design, it would be wise to understand a few best practices which have guided content creators, across the world, through numerous design-based trials and tribulations.
Here is what you must do in order to create a compelling infographic design from scratch.
1. DETERMINE YOUR OBJECTIVE
First and foremost, you need to determine the specific objective behind creating an infographic design. What really is your purpose? Are you a business intending to use infographics for generating leads and triggering conversions? Or are you a blogger who is merely interested in educating his audience about some latest research?
Knowing your motive for crafting an infographic design can help a great deal in devising its structure, layout, pattern, and content.
2. COLLECT YOUR INFORMATION
Once your purpose is clear, you must begin gathering as much information as you can about the details that you intend to carry. Who is your infographic design focusing on? Are you aware of the interests, preferences, hobbies, social statuses or demographic profiles of your target audience? Do you know which sources you must refer to for ensuring data accuracy and authenticity?
Curating such information wisely can help you decide which segments are important enough to be included in the infographic design and which parts of the informational whole can be easily dispensed with.
3. START WITH THE HEADER
When it comes to infographic design, the very first thing that your audience tends to notice is the header. So, if you want to grab their attention, you need to start with this particular feature.
Here are a few ways you can create a captivating header design:
- Write a short, succinct and catchy title which gives your readers a gist of the infographic’s contents.
- Use a large, preferably bold font to make your header stand out. The idea is to craft a header that instantly catches the audience’s eye.
- Choose a background color that is different from the rest of the text. This will give your header a depth of design while helping it become more noticeable.
- If possible, add some form of a visual element within the header itself. This could be a photo, a pattern, an icon or a graphic.
Learn Project Management
Become an agile Project Manager, gaining the skills needed to flawlessly manage projects from start to finish.
4. DESIGN THE BODY
The most significant part of your infographic design is actually its body. This is because it is the body which carries a detailed account of the information that you are trying to convey.
Therefore, while designing the structure of your infographic’s body, here are certain things that you must bear in mind:
Visualization–
To begin with, you must know which format would prove to be the best for visualizing your data. You can choose from among a wide range of prospective formats like bar graphs, pie charts, line graphs, maps, Venn diagrams or scatter plots. Each one of these styles can represent a plethora of topics in a unique and interesting way.
For instance, consider the following **infographic example: **
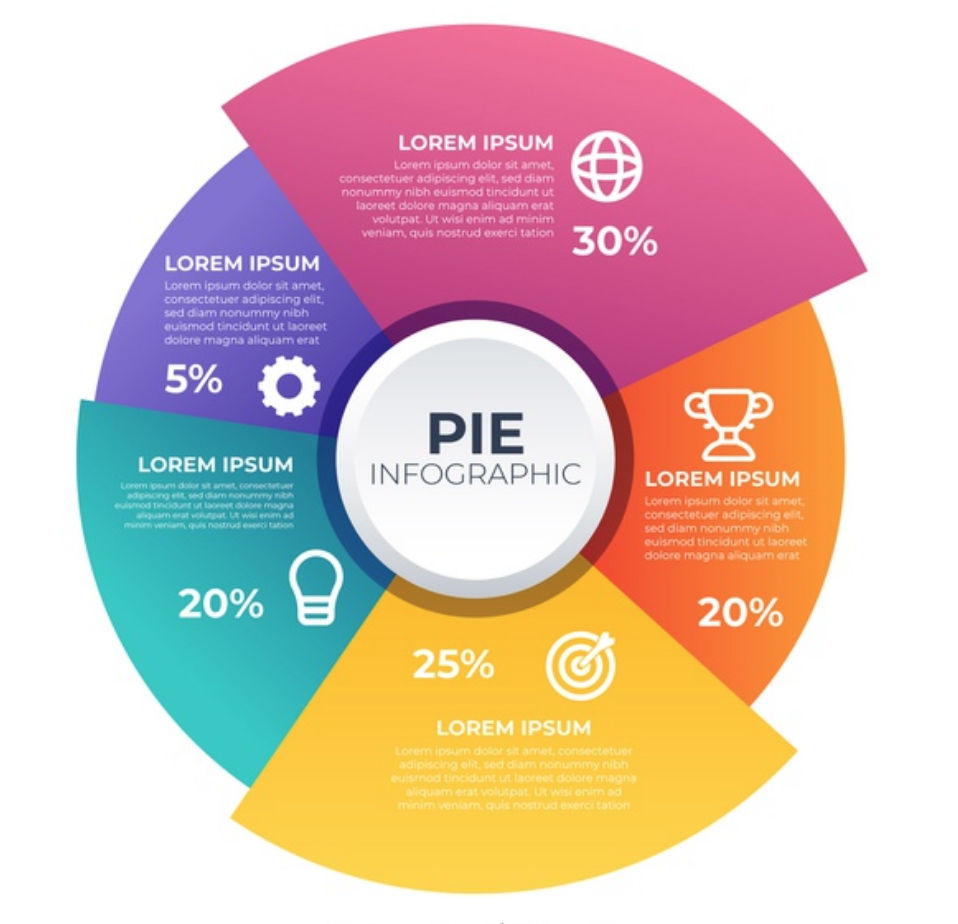
This pie chart can easily showcase the amount of revenue that is directed by the government towards different economic sectors. However, it cannot be used to compare revenue changes over time. For that, you will have to use a bar graph. Similarly, maps can be used to contrast elements like pollution, population, and temperature. But, they cannot be used to represent the total number of anemic children with low birth weights!
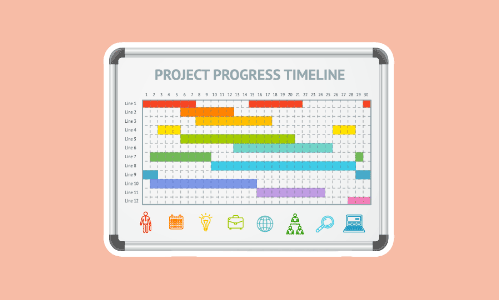
Wire-frame-
Wire-frames are generally used to design web pages. Nonetheless, employing them to carve out a good infographic design can be highly beneficial. Start by planning out your infographic in comprehensive detail and draw its structure on paper. Now, decide the exact place where each data set would be placed so that the infographic becomes easy to read and understand. Juxtapose this wire-frame on to the actual design and fix the final layout.
Symmetry–
Infographic symmetry is often overlooked by most content designers. Nonetheless, it is an extremely important element, especially because it provides a sense of balance to the readers. To understand this better, go through the following infographic example:
In this case, both the left and right sides of the infographic are properly aligned. This provides the audience with a semblance of stability and equilibrium. However, you are free to use an asymmetrical design to add further value to your infographic. Asymmetry does not just grab immediate attention, but it also offers a distinct design perspective. If you need help with this step,Venngage Inforgraphic Layout can help you choose the best layout and create your infographic from their templates.
Coloring-
Last but not least, focus on how your infographic design is colored. At the max, stick to 2 or 3 colors. Adding anything beyond this amount would hamper the readability of your data. Leave some white space between various sections of your infographic, specifically at the margins. Use a font that enhances both, your chosen color scheme and your data presentation. Doing this would ensure that your infographic design is appealing and comprehensible.
5. CRAFT A FOOTER
The final section of infographic design is – its footer. This part of your infographic needs to be carefully delineated and stylized. In this regard, here are a few tips that you can follow:
- Credit your company/designer at the bottom of your infographic. If possible, include a logo for greater brand recognition.
- Cite the sources from where you sourced your primary data. Make sure that these sources are properly referenced.
- Include your contact information, including social media handles within the footer space. Let people know where to get in touch with you.

The Way Forward
Approximately 65% (two-third) people in the world are visual learners, which implies that most people tend to learn by seeing, not reading. In such a scenario, the visual representation offered by infographic designs begins to become all the more relevant. Whether you put out a simple informational diagram, draw up interactive infographics or craft out animated infographics, you will need to ensure that they fulfill their primary functionality i.e. facilitation of reader appeal and understanding.
Looking to sharpen your photoshop skills? Join our top-rated online photoshop course today!