It has often been said that a great trader or investor is a great decision maker. To get the decision-making process right, you must carry an edge that will assist you in perfecting the timing of your trades, the stock-pick shortlisting process, and the filtering of quality from quantity. The edge that you can incorporate that will undoubtedly cover all these aspects is the ability to identify key levels of horizontal support and resistance. It is no secret that support and resistance have been assisting technical traders and investors ever since the concept was identified. Your approach to how you incorporate this in your routine is what truly matters, though. It is not a concept that should be exclusively relied on but rather it should assist your strategy as a method of identifying quality setups.
What is support and resistance?
There are quite a few variations of support and resistance that exist, and when used correctly, are all fantastic in their own right. The most common examples are dynamic, trendline, horizontal and fibonacci-assisted support and resistance. Each of these concepts relies on a different methodology to prove support and resistance, however, the core concept remains the same.
Learn Financial Trading
Master the building blocks of financial trading and investment, and learn to react to changes in the market at the most opportune times.
Support
Support is identified as a specific area, price or zone on the charts where you see price being upheld. Think of this specific point as a floor and the price as a tennis ball. What would you see the ball (price) do as it comes into contact with the floor (support level)? You would see the ball bounce up when it came into contact with the floor. This is the methodology of how support works. These levels are easily identifiable when looking at charts but it is important to remember that you do not create them — they exist as a result of supply and demand, which is essentially due to consumer buying and selling activities. Your job as a decision maker is simply to identify where exactly that ball and floor reaction point is so that you can use it as a part of your trading process.
Resistance
Resistance, on the other hand, follows a similar but inverse methodology in comparison to support. Resistance is a level where you see the upward flow of price get rejected. An easy comparison to remember this concept is to think of the resistance level as a ceiling and, again, imagine price as the tennis ball. Now picture yourself throwing that tennis ball at the ceiling. Naturally, you would see a reaction between the tennis ball and ceiling that would result in a downward directional price change.

As an investor looking to buy shares, you would initially be more interested in support levels because you are looking for confirmation to execute your trade but you must remember that identifying key resistance levels is just as important as they can show you potential barriers or offer you insight into where you could sell your shares for potential profit. Barriers formed by key price levels are expected but they are not something that should prevent you from getting into a trade because a barrier could just temporarily interrupt the momentum of price, not necessarily restrict it indefinitely.
How to find support and resistance levels
Support and resistance levels are merely indications of where price reacted and where price could react again in future. This does not necessarily mean that support and resistance levels are always going to be respected by momentum though. The movement of price could completely smash through these pre-existing levels as if they weren’t even there in some cases. You can never anticipate what price might do at the levels before it reaches them, you should only react to what you see in the moment. There is no point in trying to guess, hope, predict or assume anything in technical analysis, you must always rely on your decision-making process that is justified by weighted analysis.
So, in a nutshell, a buyer with a good strategy could use the concept of support as a confirmation tool that price has more potential to rise than not. A day trader who trades a contract for difference and speculates on selling downward price movements could use support as a barrier between their entry level and potential target zone. Remember that selling in the direction of a downward movement of price is possible too! This is when a decision maker tackles the stock market as a trader rather than an investor and uses a portion of his/her account to bet that price could continue to move further downward from their determined entry level. Again, this decision needs to be justified by a strategy and could be further confirmed by resistance. A resistance level would also be used by an investor as a level to exit a holding of shares or as an indication to tighten up risk exposure.
Support and resistance charts
Below are illustrations of what support and resistance looks like on a horizontal scale. There are many interruptions between each time price respects the key level but what your attention should be drawn to is that the price uses the horizontal level as both support and resistance over quite a long period of time. There are certain cases where you could identify (and even use) uninterrupted support and resistance but these examples are presented to you so that you can see the significance of how price remembers the horizontal level no matter how it has fluctuated between each reaction.
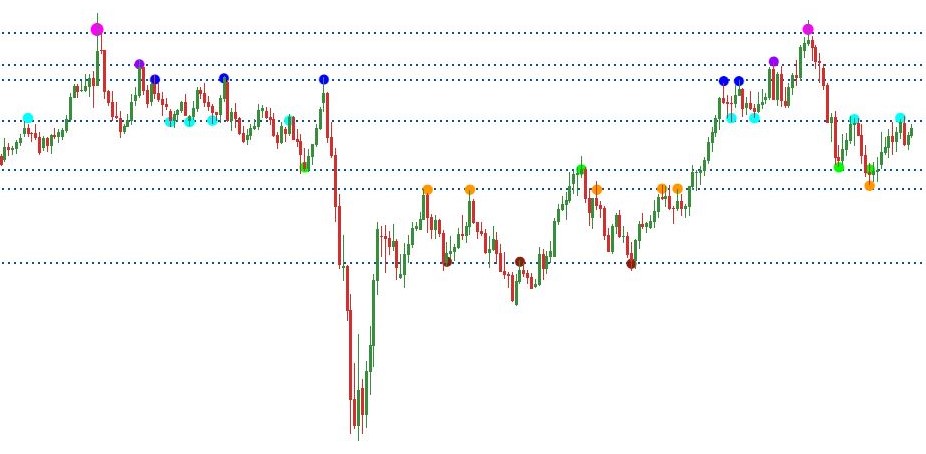
In the diagram, you will see horizontal lines spanning across the chart; these lines are identifying the important key levels spoken about, and on each horizontal line you will see a dot which pinpoints exactly where the price reaction to the key level is occurring. You will notice that each key horizontal has a specific pinpoint dot colour to help guide your eye through the multiple examples that are scattered across the chart.
The key levels of support and resistance are an amazing tool to guide and assist every trader or investor in their decision-making process, and when executed correctly, can prove to be a fantastic addition to your arsenal.