
How to get good at probability and statistics
Probability means possibility. When you are not sure of what an outcome will be you can estimate using probability. Probability means how likely something is to occur. If something has a high probability it is likely to happen. If it has a low probability, it is less likely to happen. It forms a part of mathematics that tells us the chances of a certain event happening. It ranges from zero to one.
Predicting the chances of something happening is known as the probability theory. This theory is used in probability distribution. In probability distribution, you learn the possibilities of an outcome for the given experiment. We need to know the total number of possible outcomes before we can find the probability of a single event. Statistics is the analysis of events governed by probability.
We cannot predict many events with total certainty. But we can predict the chances of an event occurring. We can look at a coin toss for example. The coin will either land on heads or tails. There is a 50/50 split in the chances of the coin landing on heads or tails. But if we toss two coins there are three possible outcomes; Heads and heads, heads and tails, and tails and tails. It is important to remember that the probability of all the events always adds up to 1. Tossing one coin results in ½ chance and tossing 2 coins results in a 1/3 chance. So the sum of all the chances adds up to one.
Consider the coin toss example, we can infer the probability of an event is equal to the ratio of the number of favourable outcomes and the total outcomes. In some cases, people get confused between favourable and desired outcomes. We can use the following formula to predict probability:
PE (Probability of event occurring) = number of favourable outcomes / total number of outcomes
Using the example of a rolling die we will apply the formula. When we roll die it will land on one side facing up. It means that the number of favourable events is 1. Although there are 6 different sides the dice can land on. It makes the total number of outcomes 6.
PE = 1/6
Knowing the total number of outcomes of an event is a good way to determine probability. If we continue with the example of using a die. When we roll a single die there are only 6 probable outcomes, when we roll two die there are 36 combinations that could occur. If we would like to know the probability of the outcome having the sum of 10. We do not need to calculate the total number of outcomes, only the possible combinations. In this case, it is 4 and 6, 5 and 5, and 6 and 4.
PE = 3 / 36
= 1 / 12
Different types of probability
There are different types of probability. The three major types are theoretical probability, experimental probability, and axiomatic probability.
Theoretical probability is the chance of something happening. It is based on deductive reasoning behind the probability. The example we used when we were tossing the coin is a good example of this.
Experimental probability is based on the observations that are made from an experiment. It can be calculated by using the total number of trials conducted. An example would be the dice being tossed 10 times and seeing how many times it would land on the number 3. Let’s say it landed on 3 6 times. So the probability due to the experiment is 3/5.
Axiomatic probability is a set of rules that are known as axioms that are set that applies to all types of probability. These were set by a man called Kolmogorov and therefore they are known as Kolmogorov’s three axioms. These rules calculate the chances of an event occurring or not occurring.
Equally likely events and complementary events
Probability is broken into equally likely events and complementary events. Equally likely events speak for themselves. They are events that have the same theoretical probability of occurring. A sample space is a set of possible outcomes to occur. With equally likely events the result of the sample space is called equally likely when there is the same probability of them occurring. Complementary events only have two outcomes: the event will either happen or it won’t.
Probability and statistics
When the probability is used in math it is most commonly used when working with statistics. Statistics is the study of the collection, analysis, interpretation, presentation, and organisation of data. In short, it is the method of collecting data and summarising it. The data collected is quantitative and qualitative and is used for analysis. Quantitative data can either be discrete or continuous. Discrete data has a fixed value and continuous data has a range of values.
Probability and statistics terms
There are many different terms used in probability and statistics which I will discuss one by one.
Random experiment
A random experiment’s result cannot be predicted until the experiment is complete.
Random variables
Random variables are the variables that make up the possible outcomes of a random experiment. They have two types:
- Discrete random variables take only those distinct values that are countable.
- Continuous random variables take an infinite number of possible values.
Independent event
An independent event occurs when one event has no impact on the over event. Both terms are considered independent. An example would be if you are tossing a coin and throwing a die at the same time. The outcome of each will not affect the other.
Mean
The mean is the average of the random values of all the possible outcomes. It can also be called the expectation of a random value. It is the expectation of the possible outcomes repeated several times. The equation we use to find the mean is the sum of all the terms divided by the total number of terms.
Expected value
The expected value is the mean of the random variable. It is also called the expectation, mathematical expectation, or the first moment.
Variance
The variance tells us how the values of the random variable are distributed around the mean value. It is calculated by using the average squared deviation of each data point from the population mean. The formula can be created by summing up the squared deviation of each data point and dividing the result by the total number of data points in the set.
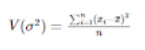
Xi = ith data point in the set
μ = population mean
N = the number of data points in the population
Median
The median is the middle value of the data set. It is the N number of grouped or ungrouped data sets. The median is found right in the middle of the data set.
Median = (n + 1) / 2
Standard deviation
Standard deviation is a measure of how spread out the numbers are. In other words, it shows us how broadly individuals in a group may change.
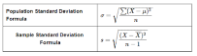
Xi = Terms given in the data
N = Total number of terms
X= Mean of the data
Statistics and probability explained with an example
Let us have a look at an example where we use statistics and probability. Imagine you have a bucket of tennis balls. In this bucket, there are 5 red balls, 5 blue balls, and 4 green balls. You close your eyes and randomly pick 2 balls out of the bucket, and then you pick up the 3rd ball. What is the probability that you picked 2 green balls and then a blue ball?
We need to know the total number of balls:
5 + 5 + 4 = 14 balls
The probability of picking a green ball:
1 green ball = 4 / 14
Now that there is one less ball, you pick another green ball:
1 green ball = 3 / 13
Lastly, the probability that you picked up a blue ball:
1 blue ball = 5 / 12
We can then need to multiply all the answers together to get the answer:
(4/14) x (3/13) x (5/12) = 5 / 182
There is a 5 in 182 chance that you will pick 2 green balls and a blue ball.
In conclusion
Unfortunately, there are no tricks and hacks when it comes to probability. Understanding the importance of probability and statistics is already a step in the right direction. Practicing the formulas and understanding the concepts ensure you have a good foundation for becoming a pro. You can start applying the concepts to everyday activities such as a coin toss, rolling rice, or a deck of cards. The more you practice using a variety of random experiments the better you will become at probability and statistics. Soon enough you will be solving problems with ease.
Want to learn more about probability and statistics? Don’t hesitate to sign up for our online Probability and Statistics Course.